FACT24 ENS+
Release Notes
Portal Version 3.29
Portal Version 3.28
Portal Version 3.27
Portal Version 3.26
Portal Version 3.25
Portal Version 3.24
Portal Version 3.23
Portal Version 3.22
Portal Version 3.21
Portal Version 3.20
Portal Version 3.19
Portal Version 3.18
Portal Version 3.17
Portal Version 3.16
Portal Version 3.15
Portal Version 3.14
Portal Version 3.13
Portal Version 3.12
Portal Version 3.11
Portal Version 3.10
Portal Version 3.9
Portal Version 3.8
Portal Version 3.7
Portal Version 3.6
Portal Version 3.5
Portal Version 3.4
Portal Version 3.3
Portal Version 3.0
Portal Version 3.2
Getting started
Setup
Managing ENS+ users
Creating your organizational structure
Caller IDs
Address registry
Categories
Dictionary
File manager
Download Center
Your Account
Two-factor authentication (2FA)
Configuration
Persons & Groups
Alarm configuration
Alarms
Launch Forms - Configuration
Message templates
Calendar
Location profiles
Geolocation profiles
Whitelists
Jobs
Events
Telephone quickstarts
Survey
Alarm Templates
Alarm Flow
Interfaces
Operating Cockpit
Alarm Cockpit
Activate and stop alarm
Launch Forms - Trigger
Ad hoc alarm
Alarm monitor
Chat
Phone Conference
Video Conference
Surveys
Reports & Statistics
Loneworking
FACT24 Mediagateway
Microsoft Teams Bot
Web login for persons
Add-on modules
FACT24 ENS+ Incident Management
Telekom Settings Cloud of Things Narrow Band Interface
FACT24 ENS+ External API (REST) – Functionality Scope
FACT24 AI
Migration to ENS+
FACT24 CIM
Release Notes
New functions through FACT24 CIM release V.27.01
New functions through FACT24 CIM release V.26.01
New functions through FACT24 CIM release V.25.03
New functions through FACT24 CIM release V.25.02.01
New functions through FACT24 CIM release V.25.02
New functions through FACT24 CIM release V.25.01
New functions through FACT24 CIM release V.24.03
New functions through FACT24 CIM release V.24.02
New functions through FACT24 CIM release V.24.01
New functions through FACT24 CIM release V.23.02
New functions through FACT24 CIM release V.23.01
Getting started
FACT24 CIM starter - crucial steps
FACT24 CIM essential
FACT24 CIM advanced
Introduction
Start Page
Admin workspace
The FACT24 CIM Roles
Navigation
Search
Levels
Contacts
Locations
Working with incidents and alarms
Tasks and Action Cards
Chat (previously Case Manager)
Task Manager
Action Cards
Functions of Action Cards
Pre-defined Action Cards
Logs
Reports and Statistics
Templates
Risk Analysis
Mobile App (FACT24 ENS+ and CIM)
App Releases
App-Version 3.28
App Version 3.26
App Version 3.24
App Version 3.22
App Version 3.21
App Version 3.20
App Version 3.17
App Version 3.16
App Version 3.15
App Version 3.13
App Version 3.12
App Version 3.10
App Version 3.9
App Version 3.8
App Version 3.7
App Version 3.5
App Version 3.3
App Version 3.2
Download & Basics
FACT24 ENS+ App Section
Basics and Login
General Settings
Account
Location Services
Group Management
Triggering Alarms
Editing Alarms
Active Alarms
Chat in the ENS+ Application
History
Reports
Emergency Plans
Lone Worker Protection
Special Smartphones
FACT24 CIM App Section
Support
Table of Contents
- All Categories
- FACT24 ENS+
- Reports & Statistics
- Alarm statistics
Alarm statistics
Here you can find some overarching numbers on your alarms.
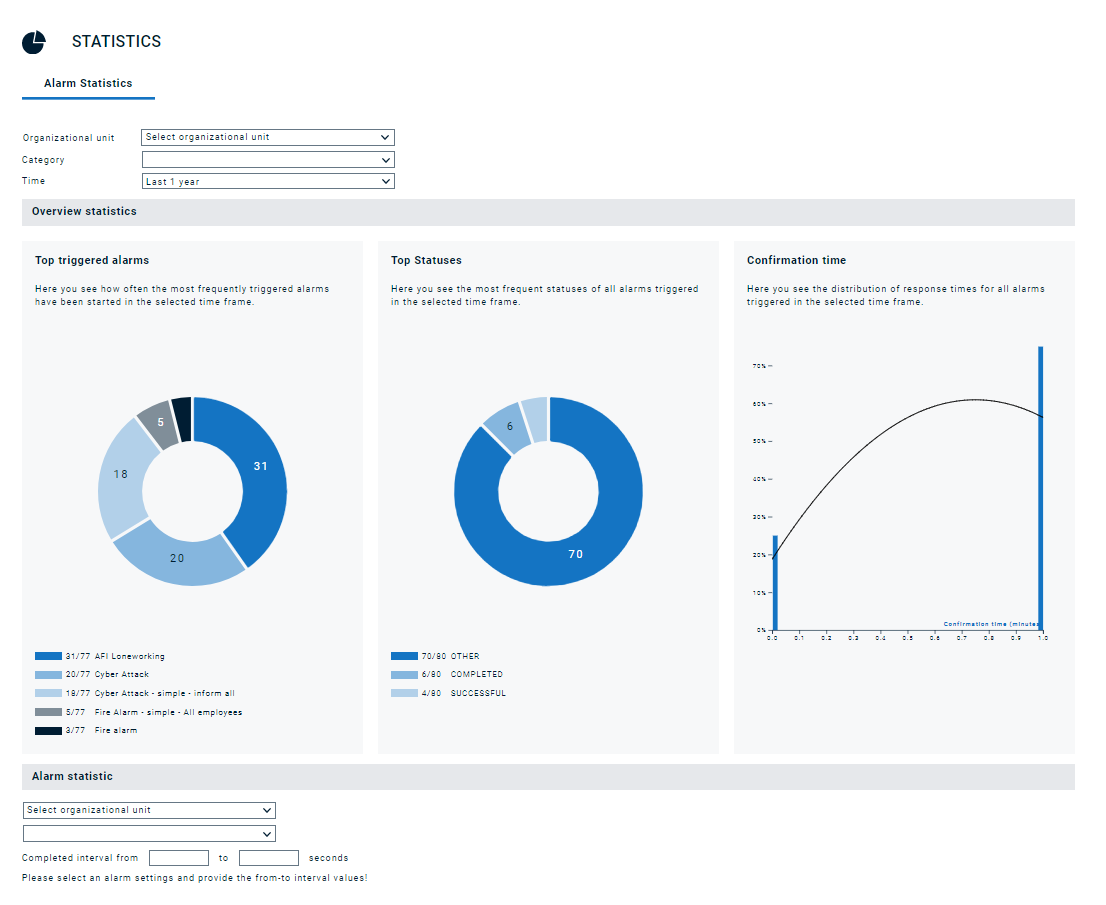
You have the following two filter options:
- Organizational unit: Limiting the selection via the «Organizational unit» filter. Once the organizational unit and period are selected, users can utilize the Alarm Mode filter to sort alarms accordingly:
- All: This option combines both test and live alarms.
- Test: It presents alarms triggered in Exercise Mode.
- Live: This option displays only live alarms.
- Period: Dropdown menu with presets to select the desired time period. The selection always references the day on which the statistics are viewed:
- Last 24 hours
- Last 7 days
- Last 1 month
- Last 1 year
General statistics
This area shows the numerical distribution of the top 5 alarms and a detailed distribution of their status. The different distributions are separated by colour and a curve clearly shows the distribution of confirmation time.
Alarm statistics
For a detailed view into an individual alarm, it can be selected from a drop-down list and the "time window for acknowledgement" can be specified in seconds. The donut gives information about the distribution how often a specific alarm has expired in the above-mentioned time period and how often it has been acknowledged or not acknowledged within the considered time. The distribution curve also shows how the acknowledgement of this alarm is distributed over time.